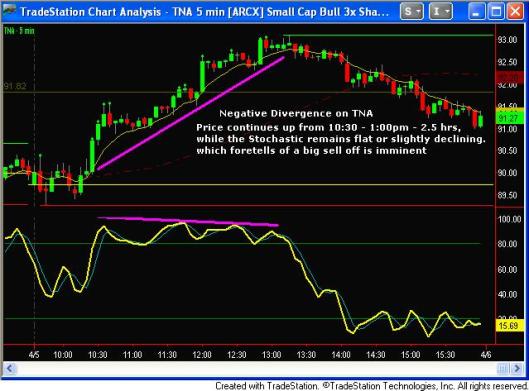
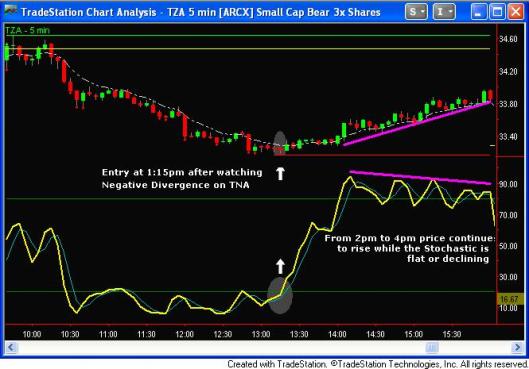
4-5-11: Negative Divergence on TNA for Over 2 Hours

The top chart is the 5 min. TNA; the 2nd chart is 5 min. TZA.  Notice how TNA price has been steadily going higher from 10:30 to !:00Pm, almost 2.5 hours; while the Stochastic is NOT following along.  The Stochastic is making lower or equal highs. This is negative divergence which means a price drop is imminent. When you see this happening over several hours it’s time to start monitoring TZA for an entry. If you go to the 2nd (TZA) chart you will see at 1:15pm where we entered at 33.26. The price peaked at 33.96 for a 70¢ price gain. Also not on TZA where Negative Divergence patter is occurring from 2-4pm. Price keeps increasing while Stochastic is making lower highs. You will also note that the following trading day there is a huge price drop at the open.
4-1-11: Classic V Shaped Stochastic SetUp on TZA

When you see a clean Stochastic pattern like this setting up you have to take it.  A perfect V shaped patter. The entry occurred when the Stochastic crossed over at 2:15pm. The price peaked at $34.98, approximately 80¢ in less than an hour, a big move for TZA.  Its a little hard to see on the chart, however, when we took the trade, that green trigger candle was the 5th one in a row that had pulled down below the 8EMA line. A secondary confirmation to take the trade.

3-31-11: 8EMA Entry Using 2 Minute Chart

The first chart is the 5 minute TNA which we use to find the setups and the second chart is the 2 minute TNA chart that we use to hone in to find better (lower) entries.  We saw the set up on the 5’s at around 10:10, the stochastic crossing over northbound and the price pulling lower below the 8EMA. We then go to the 2 minute TNA chart, shown below,  where we see 3-4 candles below the 8EMA.  Our entry is 86.92 and within 1/2 hour the price peaks at $87.95, over a $1.00 move.  Also note around 10:40am where the price has pulled away from the 8EMA on the high side. This is your signal that its time to exit the trade.  Also notice a 2nd trade that we could have taken  around 11:45am, same circumstances, a Stochastic crossover and price gapping below the 8EMA line. That setup worked as well. A $1.00 plus move but took a lot longer.

3-29-11: Classic 8EMA Setup Over $2.00 Move in 1/2 Hour

Chart shows the 5 minute TNA.  Note candles pulling down lower away from the 8EMA line.  At 9:50 the Stochastic crosses upwards and the set up is complete. The entry is one point above the red candle – $81.o2.  At 10:20 the price peaks at $83.22; over a $2.00 move in half an hour.  Note the number of candles after 10am that have pulled higher above the 8EMA line. When you see this happening thats when you want to be planning your exit strategy before the price pulls back to the 8EMA line. You can always get back on later.

3-25-11: Negative Divergence

Notice the long period of negative divergence on TNA. The price continues on an uptrend trend, while the stochastic is NOT following along. Its making lower highs. This is a sign of an impending price drop. When you see this on TNA, start monitoring TZA for an entry. The  top chart is the 5 minute TNA, the bottom chart the 5 min. TZA

3-24-11: The 8 EMA Pinpoints Entries & Exits

The 8 EMA line acts like a magnet or a slingshot. When the price moves away from the 8 EMA line either up or down, it always comes back to the line. Note on the 5 minute TNA chart below at 10.20am where the green bar pulls away from the 8EMA.  At the same time, the Stochastic crosses over northbound. This was a great entry at 78.48, up over $1.50 in 40 minutes.  Notice also the green candle at 11;00am pulling above the 8 EMA line; this is your signal to exit the trade before the price pulls back to the 8EMA.  Also note below the numbers 1 and 2 above the Stochastic.  You will see the 1st entry at 10:00am did NOT work; you will also see that at that time the price had not pulled away from the 8EMA; however, the 2nd time it did, and that time it worked. Note the Negative Divergence which preceded the cliff drop at 12:30pm.  Then notice around 1:05pm when the stochastic starts to turn back up again, the price pulls below the 8 EMA line.  We got on at 79.60. That one took a little longer to make its move, but we did manage to make a $1.00 on the second set up as well.

3-23-2011 Another Huge Stochastic Divergence Winner

Note the Negative Divergence forming up on TZA in the first image. The price is going higher while the stochastic is slightly on a downtrend. This is the third attempt at a pullback and note that the 3rd peak is lower than the 2nd peak, while price continues higher.  As soon as we notice this pattern, we immediately go to our TNA chart (see 2nd chart below) to watch for a buying opportunity.  This was a strong signal as the divergence pattern took place over a period of approximately 1.5 hours, enough time to make any sort of price move significant. As soon as we got the crossover on the TNA chart, (the K line crosses the D line below the 20 line) we loaded the boat, full load on this trade, even Andrea Bocelli could see this was going to be a big winner – which it was!

TNA

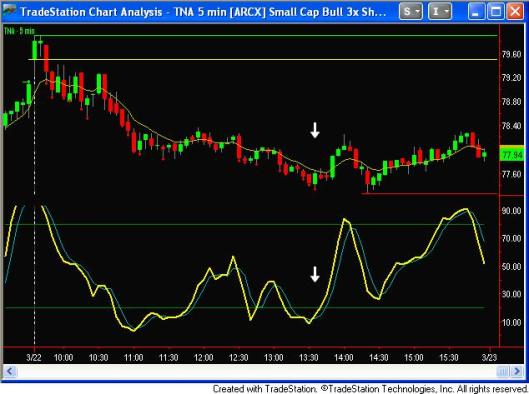
3-22-2011 Another Quiet Day in The Market

Note the Negative Divergence (the price continues to make higher highs while the Stochastic is making lower highs) that was forming on TZA from 12:30 to approximately 1:40pm at which time both the Stochastic and the price turned down abruptly. As this was happening we were monitoring the TNA chart (see below) and took a position at 77.87 at 1:42pm; the price peaked at 78.65, a gain of 78¢ in less than an hour.  Then at 2:07pm we bought TZA at 39.90 (note the perfect VEE clean formation) and it went up as high as $40.23 before backing up, for a gain of 32¢.  Normally we like to see both the K and D lines of the Stochastic go below the 20 line before turning back up; however, since this was such a perfect example of a downward trajectory, it proved to be a good set up.

TNA

3-21-2011 First Day After Libya Bombing

A lackluster day. Most of the advance took place in the premarket and most of the trading session saw a ranging market. We show an example of positive divergence in the chart below.  Note how the price continued down from approximately 1:15 to 1:45 while the Stochastic was on an upward trek.  Our entry was $77.96 at 1:56pm, a 50¢ winner in less than 30 minutes.